
Web performance is continous
Web performance is a lot like user experience. It’s hard to just “sprinkle” in some UX and see the site get “pretty”. User experience isn’t an add-on, it’s a series of fundamental decisions. User experience means you take time to understand the user’s needs and you design your app to fit them. This isn’t a one time study either. It’s a continuous process. Web performance is the same way.
It’s difficult to “sprinkle” in some performance to speed up a slow site. Yes, there’s some easy wins. Compress images, minify files, use font-display: swap. But creating a performance focused site starts from the ground up. It’s not enough to build a performant site and take a break. It’s a continuous process. It takes continous monitoring.
WebpageTest is the best free tool to measure performance
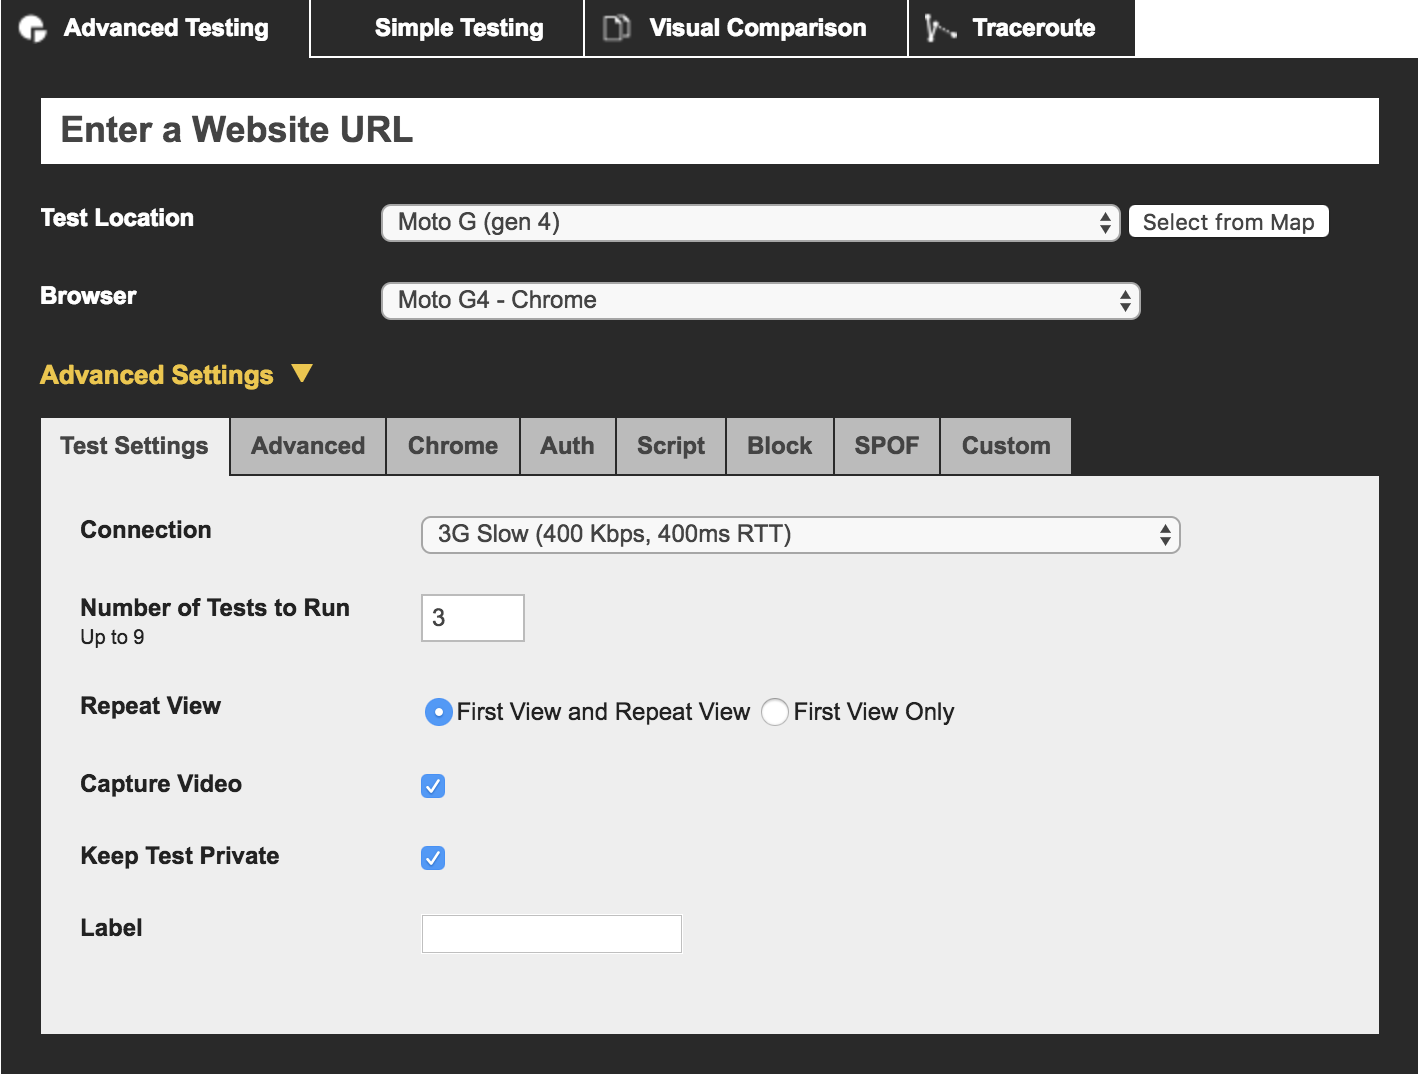
WebpageTest allows you to test the performance of a website on real devices and real consumer speeds. Test on an iPad, iPhone, Galaxy S7, and even low powered devices like the Moto G4. Set network speeds from fast FIOS to slow mobile edge networks.
WebpageTest is built and maintained by the great Pat Meenan. Give him a follow or a thank you. He deserves it.
Fast on slow means fast on fast
You might be confused by the many options provided by WebpageTest. Let’s keep it simple. Test on the lowest denominator. Fast sites on slow networks are still fast sites on fast networks. The web’s greatest asset is reach. No app stores, just links. Performant sites have better reach across the world.
Instead of messing with dropdowns and checkboxes just use the easy mode: webpagetest.org/easy.
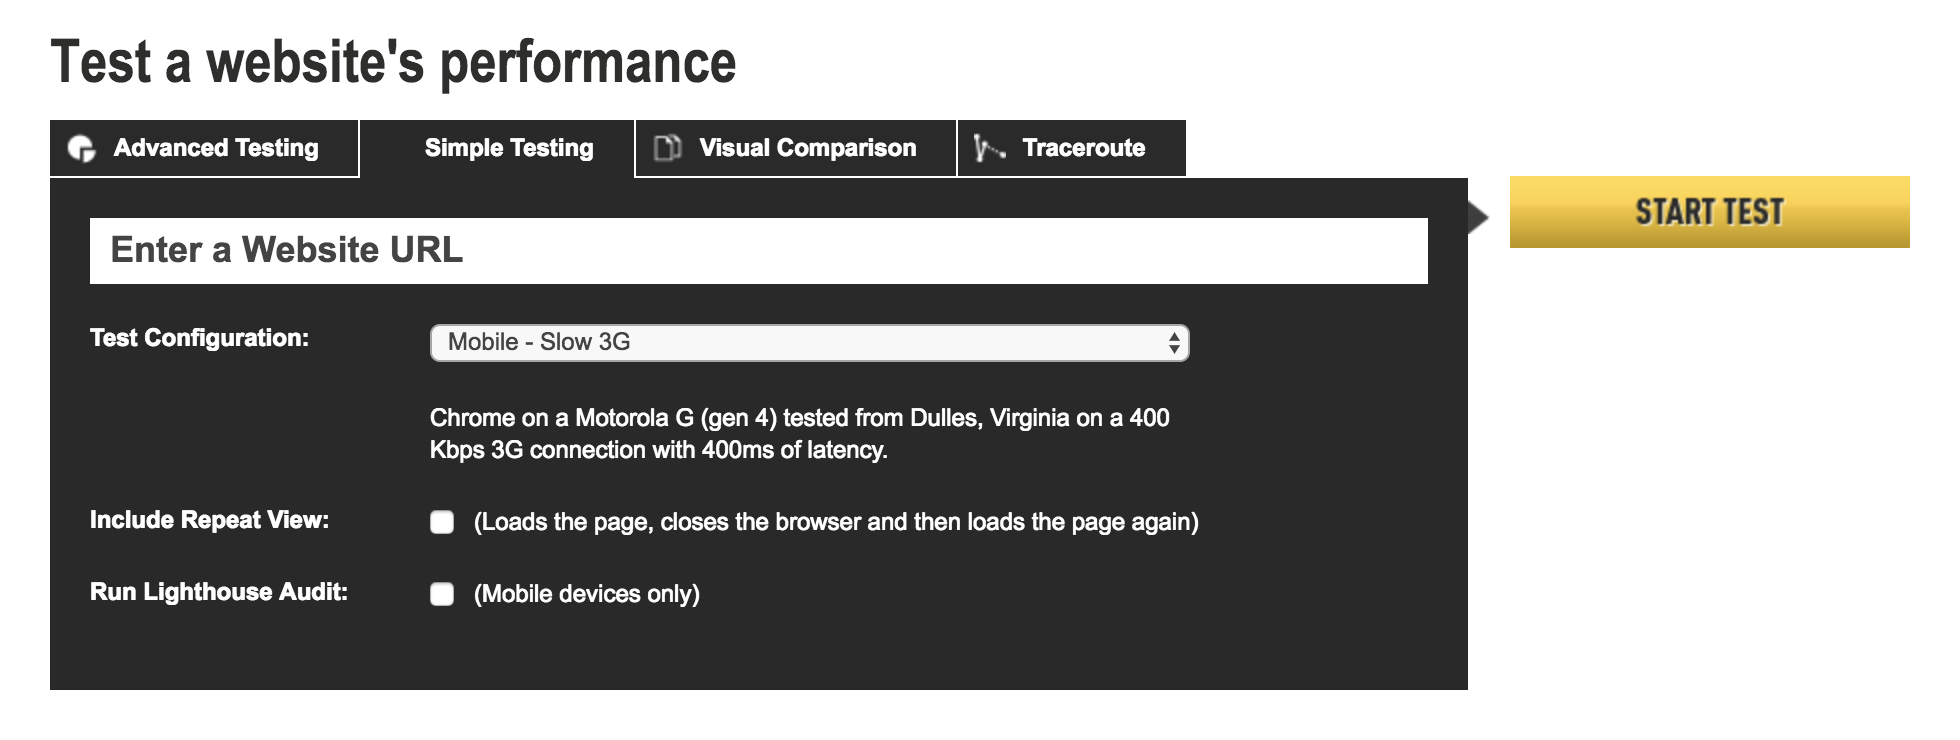
This mode uses a Moto G4 on a “Slow 3G” network. What makes this setting so slow?
- It’s a slow device. The Moto G4 parses JavaScript a lot slower than a modern iPhone.
- The bandwidth speed is 400kbps. Compare that to 4G’s 9mbps speed.
- The latency is 400ms. 400ms per roundtrip time, that’s brutal.
Don’t focus on bandwidth. While 400kbps isn’t ideal, it’s an after thought compared to the latency.
Test with high latency
Bandwidth is the measure of how much data the network can send at once. Latency is how long it takes to make a send the data roundtrip. Bandwidth is the width of the tube and latency is its length.
It’s easy to get hung up on bandwidth. More bandwidth means faster downloads right? Well only if your site is large or your in the business of large content like Netflix. What if your site contains 300kb of assets in the critical path? That meaning, your site has 300kb of HTML, CSS, and render blocking JavaScript. Bandwidth isn’t your problem. Latency is.
Mobile networks are notorious for high latencies. The “Slow 3G” setting contains a latency of 400ms roundtrip. This means that it takes 400ms for the client to receive data from the server regardless of its size. To make matters worse, the initial HTTP connection takes four roundtrips! That means it’s your site can’t begin to load other assets for at least 1.6 seconds.
Respect latency. Fight it with HTTP/2, CDNs, and reducing request chains. It’s the killer of performance. Mobile networks are fraught with high latencies, make sure to test accordingly.
The summary is just the start
The “Easy Mode” test run gives you a summary and three test runs. The summary looks a bit like this:
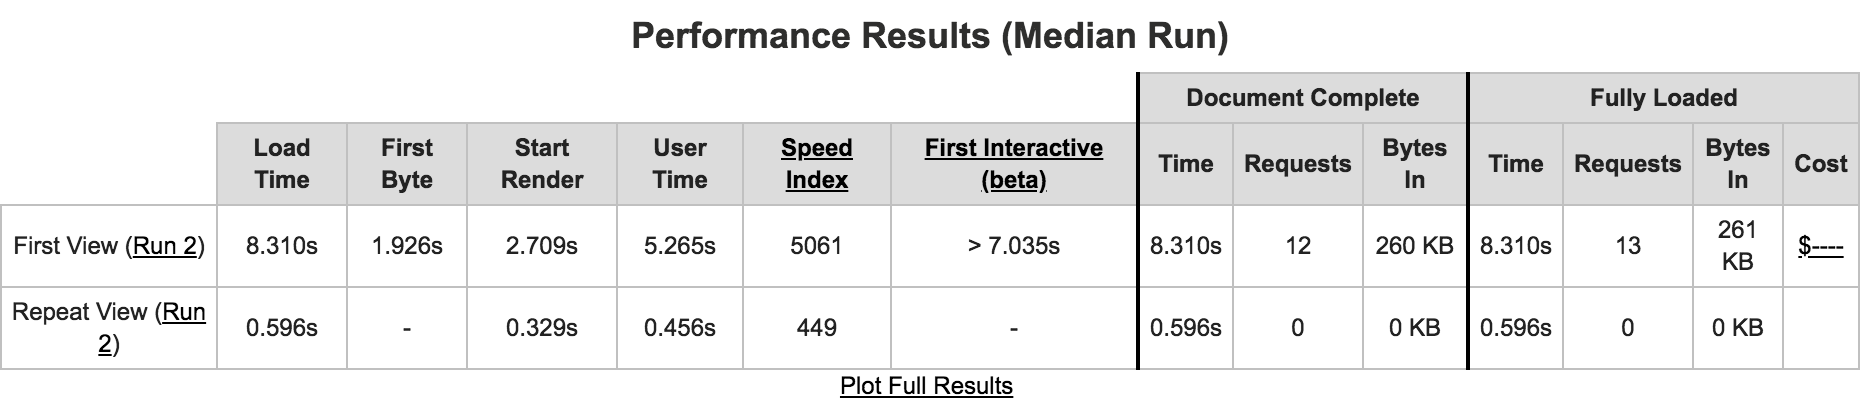
This table presents a bunch of important metrics, my favorite ones are:
- First Byte tells you how long your server is taking to send the first byte of data. This tends to be slow for high latencies, long server processes, or lack of CDN caching.
- Start Render is when the user went from a blank page to something displayed on the screen. This doesn’t mean there’s content. It could just be your header as the heavy stuff continues to load.
- First Interactive is tricky. According to Lighthouse First Interactive tells you “when a page is minimally interactive”. This means the browser’s main thread is clear at this point. It does not mean the thread will stay clear. We’ll learn about “Time to Interactive” in just a minute.
Load Time isn’t the metric you’re looking for
The metric that jumps out the most is the one I didn’t mention: “Load Time”. The “Load Time” is an paltry 5.8 seconds. However, it does not tell the whole story. According to the WebpageTest documentation: “The Load Time is the time from when the user started navigating to the page until the Document Complete event (usually when all of the page content has loaded).”
The “Document Complete” event refers to the window.onload event. According to MDN: “The load event fires at the end of the document loading process. At this point, all of the objects in the document are in the DOM, and all the images, scripts, links and sub-frames have finished loading.”
While this metric is good to know, the page is possibly usable before this events fires. Deferred scripts and images inflate this number even though the site is likely usable.
To understand the real story of what’s going, we’ll need to look at the “Filmstrip View”.
The Filmstrip View is where the important metrics live
I rarely focus on the summary. I may glance at “First Byte” to make sure nothing funky is going on. But I’m quick to jump into the Filmstrip View.
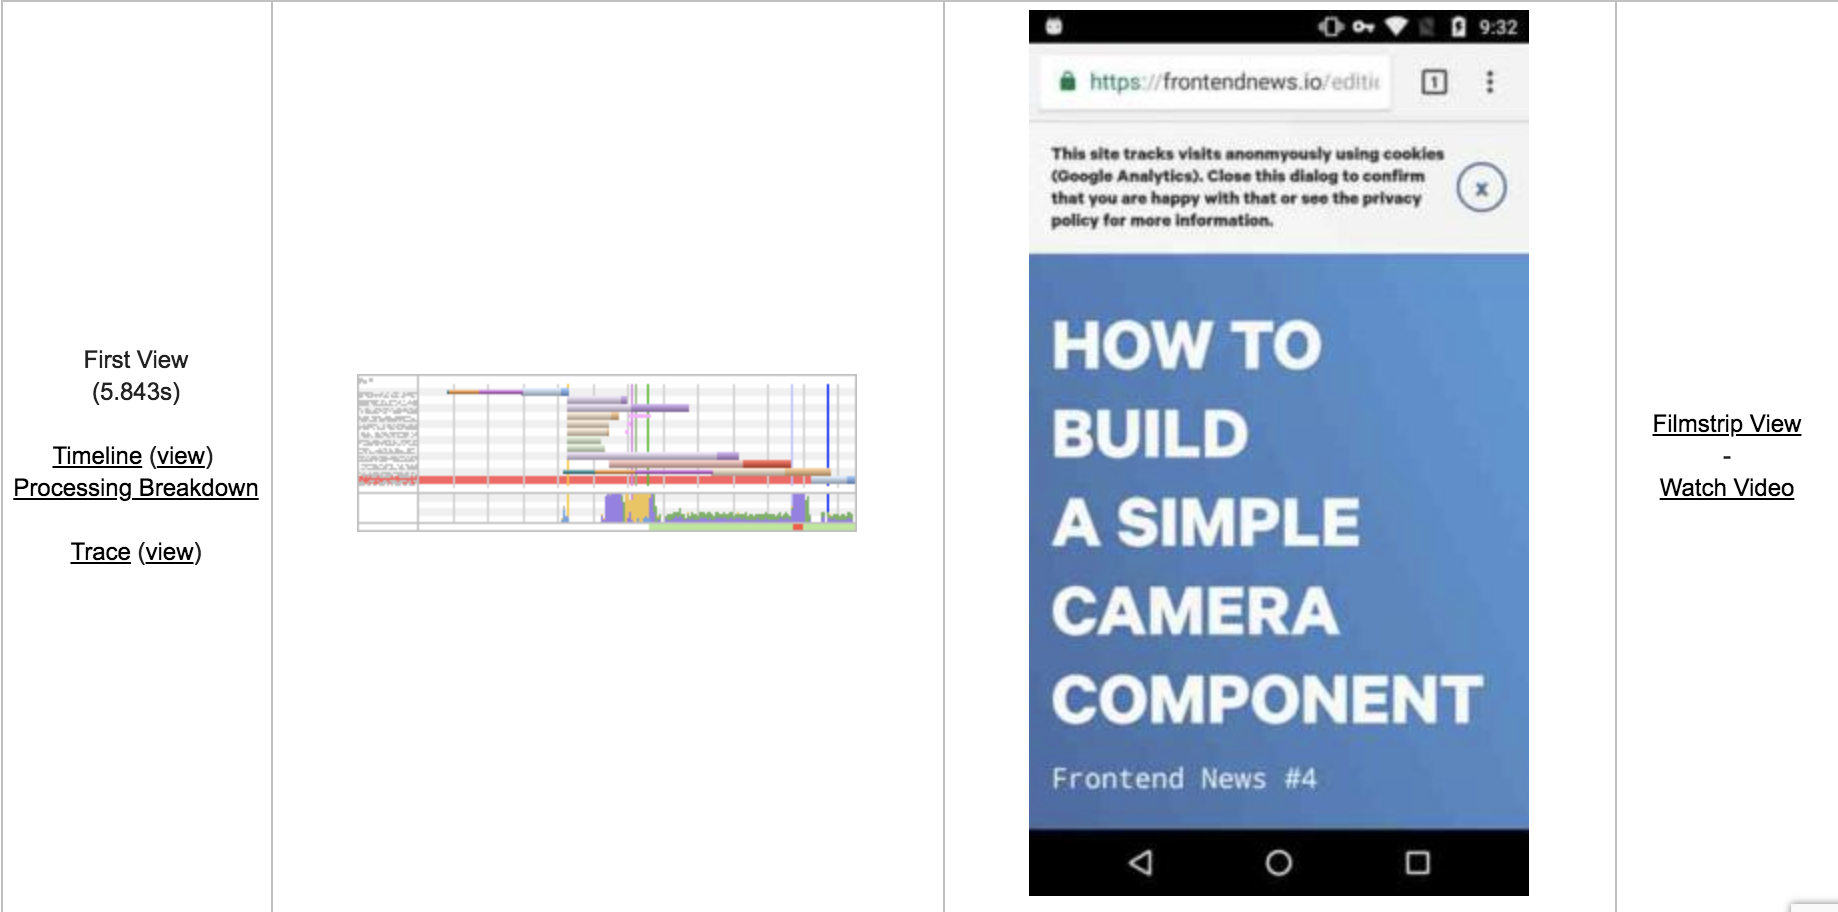
To the right of each test run is a link to the “Filmstrip View”. This is the page you’ll use the most. The Filmstrip View provides you more than numbers. It gives you a visual play-by-play of what’s happening during page load.
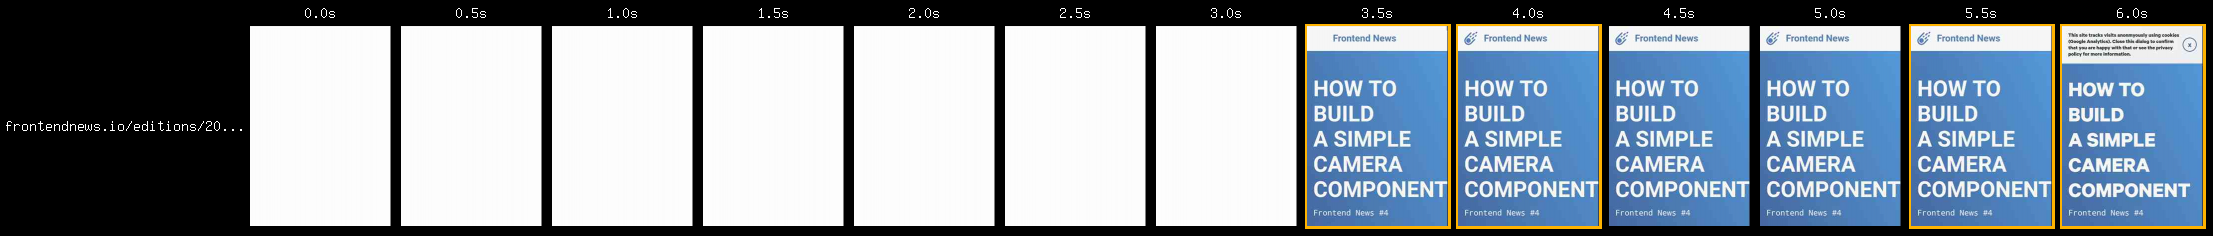
This collection of scrollable thumbnails shows you what it feels like waiting for the page to load. You can even change the interval between thumbnails. The default is 0.5s, but you can set it to 0.1s or even 60FPS. I usually pick 0.1s because it makes it much easier to consult the network waterfall below.
The network waterfall provides hints of performance improvements
Below the filmstrip is a network waterfall. Notice that the vertical red bar moves across the waterfall as you scroll through the filmstrip.
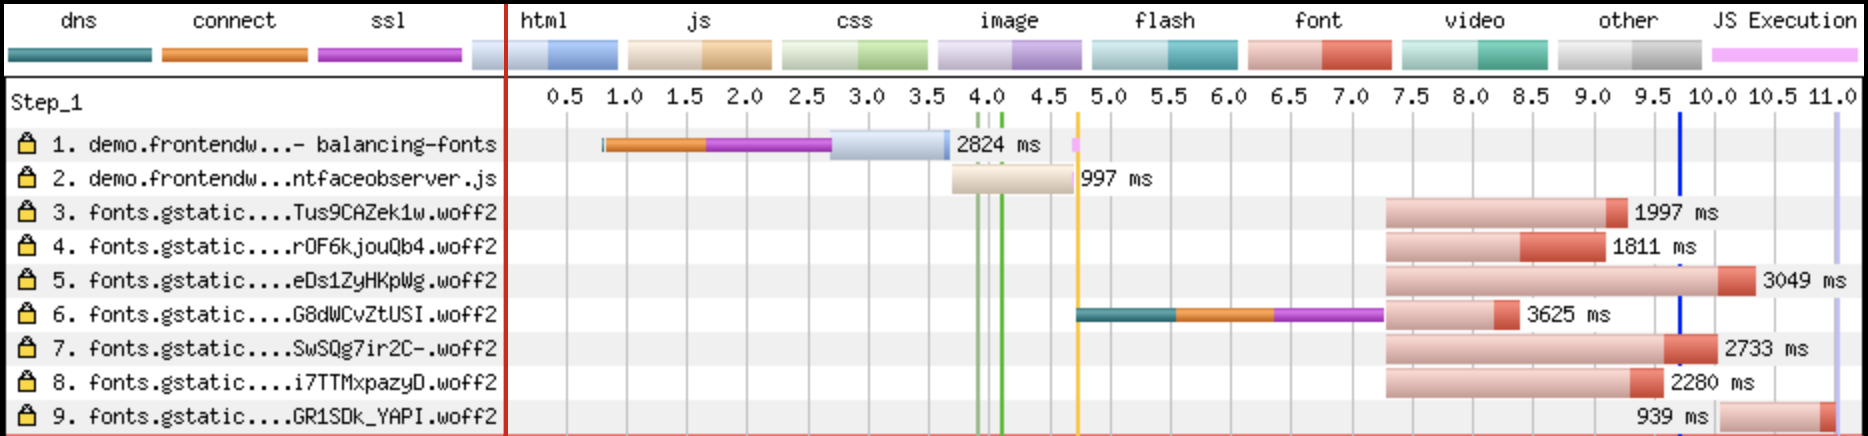
This is how you can correlate visual changes to the loading of assets over the network. As you scroll past a loaded asset you’ll see a specific change. Use this to find the series of formal page load metrics.
First Paint, First Contentful Paint, First Meaningful Paint, and Time to Interactive
The sheer amount of page load metrics is sometimes overwhelming. Focus on the overall picture of page load instead of worrying about the importance of each metric. There’s a series of formal metrics that are used to understand progression of page load:
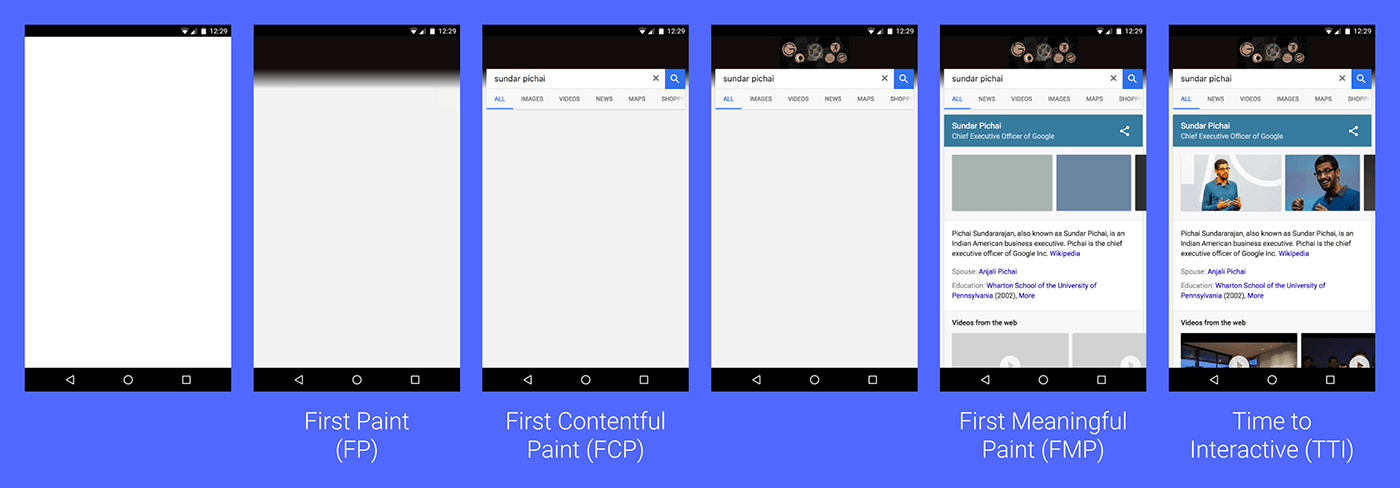
This wonderful image was sourced from Web Fundamentals.
- First Paint is much like start render. When did something at all appear on the page? This doesn’t mean the whole page is painted.
- First Contentful Paint tells you when the browser renders the first bit of DOM.
- First Meaningful Paint tells you when the primary content of the page has been loaded.
- Time to Interactive indicates when a page becomes interactive. This is defined by the page having useful content, event handlers are registered for visible elements, and the page responds to interactions within 50ms for a window of 5 seconds. This metric can tell you if your site paints quickly, but executes a lot of JavaScript and blocking the main thread. A symptom of server-side rendering in JavaScript frameworks.
The network waterfall tells you when these metrics occur. It’s easy to notice when just some content appears and when the main content appears. But how do you know when the page is interactive? The network waterfall also provides this information.
Use the network waterfall to find Time to Interactive

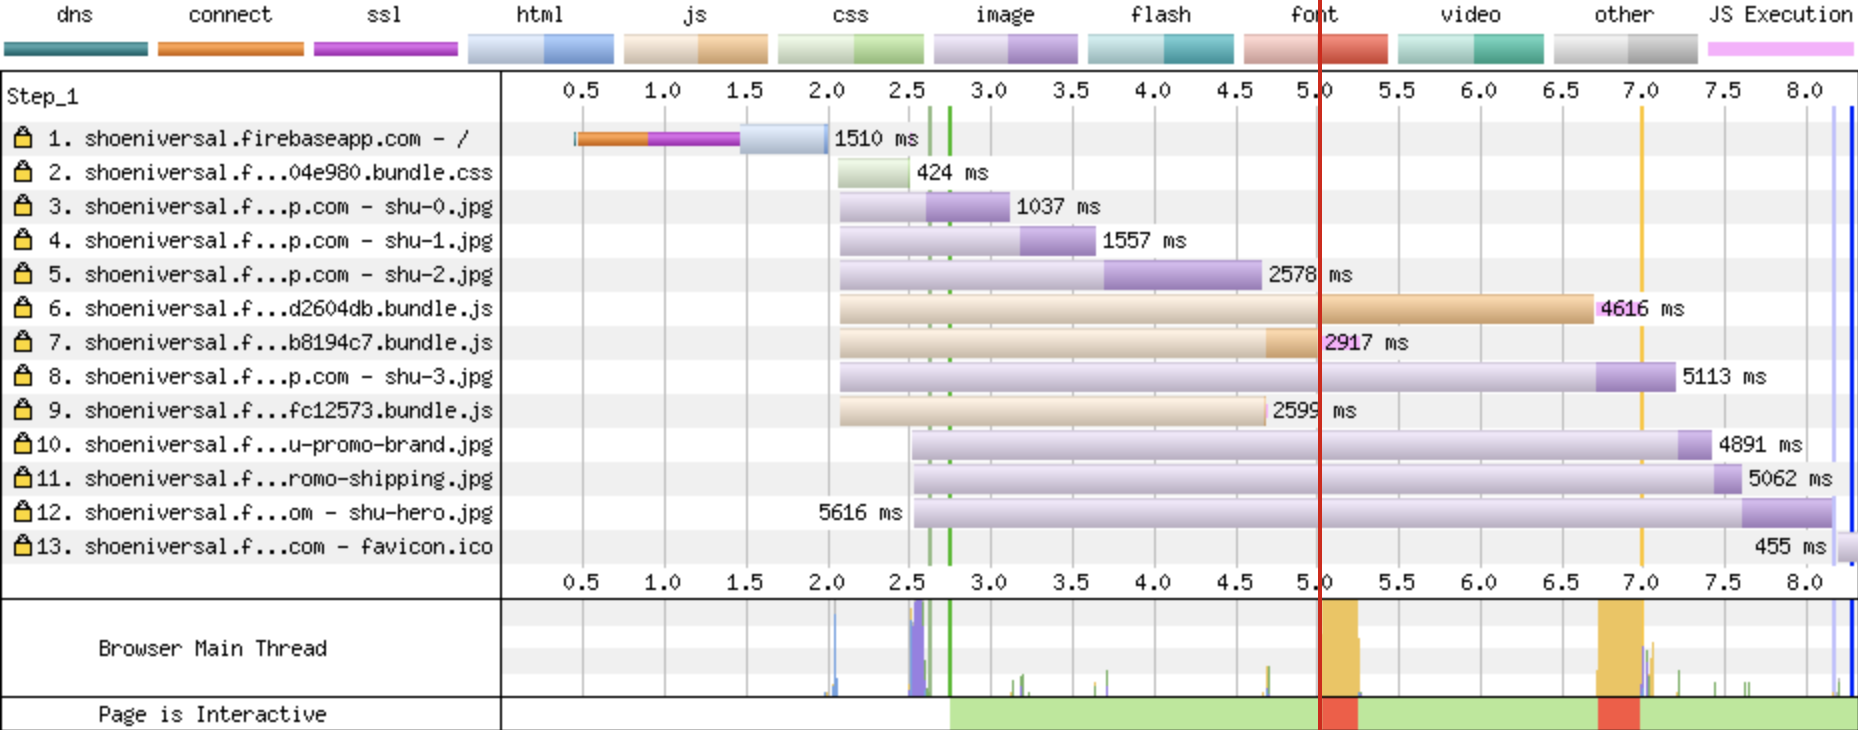
The very bottom of the network waterfall contains information about the activity of the browser’s main thread. This main thread is responsible for handling UI updates. If the the thread is blocked there won’t be able UI updates. This means the page is effectively frozen.
This graph uses red blocks to tell you when the main thread is blocked. This is common for JavaScript heavy sites, but thread blocking is not caused by JavaScript alone. In the example above we can see a large block of red below a big chunk of purple. This purple represents the layout of the screen. What’s causing this? Let’s consult the entire waterfall.
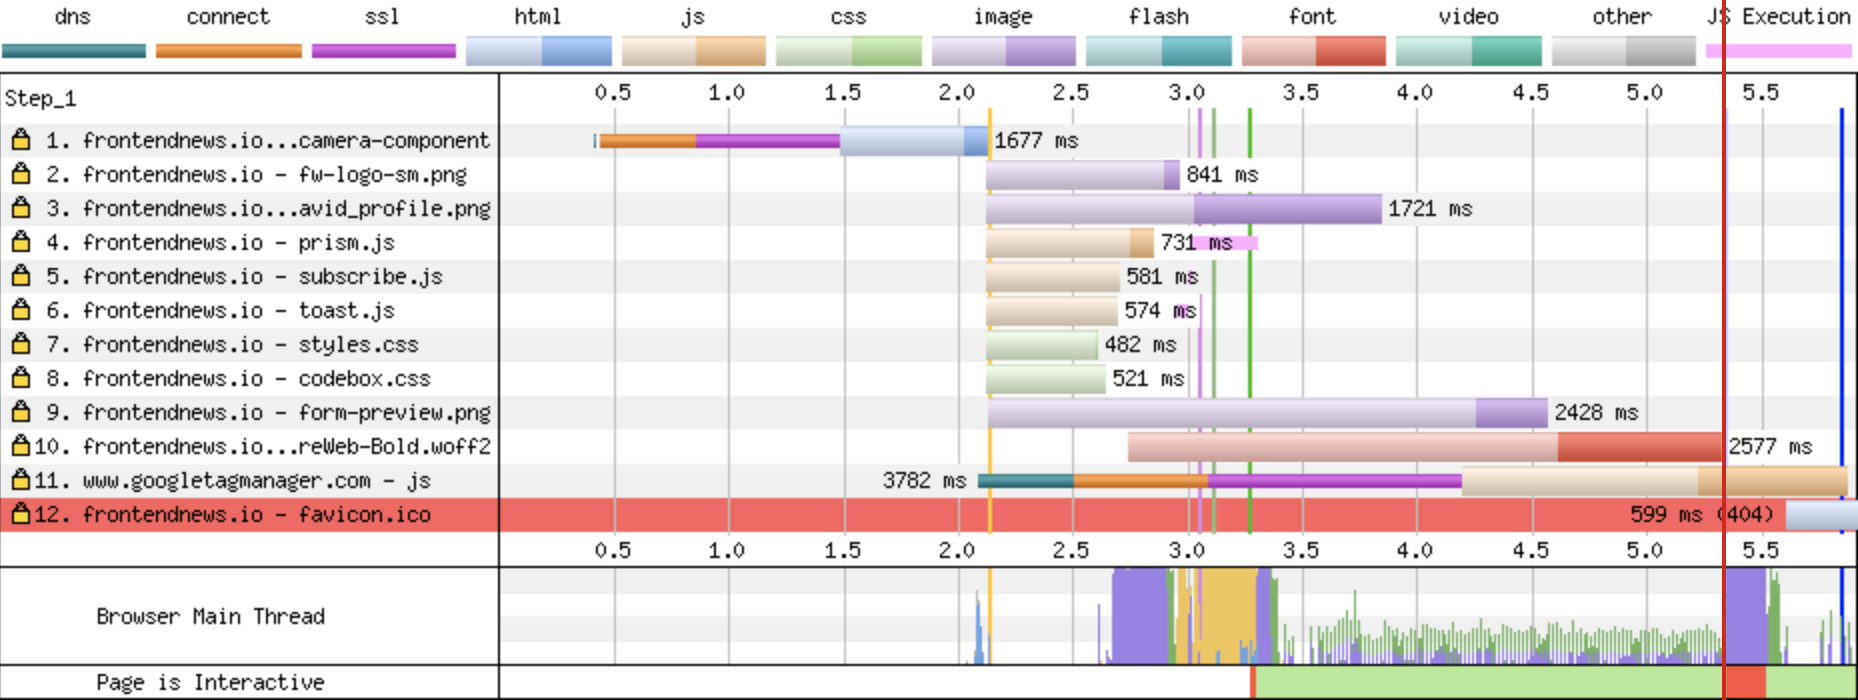
At just before 5.4 seconds a web font finishes loading. Then immediately after there’s a bunch of purple which blocks the thread. This is because of font-display: swap. The browser had to layout the page to swap to the custom web font. This was an intensive, but brief process. Remember that we’re on a Moto G4, modern devices wouldn’t have this problem.
The main thread chart is clear after this point. This means we can consider the site interactive at 5.5s. This isn’t a completely meaningful metric in this case however.
Use Time to Interactive as a guide
Time to Interactive is tricky. At first glance it can appear that a site isn’t interactive until that meric. But that’s not always the case. In the example above the thread is clear for several seconds before and after. This blocked section is a hiccup. What would be more concerning in an large chunk of red that starts early when content is visible. This is common in server side rendered sites like below:
This server-side rendered JavaScript site has a First Meaningful Paint of 2.8 seconds. However the thread becomes blocked at two separate intervals: at 5s and around 6.7s. This means the user starts to use the page but at those intervals the page freezes up. This just a small example, but this is the behavior we’re concerned about. Not just a singular small hiccup.
Page load performance is not one metric
If this guide has taught you anything, I hope it’s that page load is not one metric. Looking at “Load Time” won’t tell you when a user begins to see content. Focusing on First Meaningful Paint won’t tell you if a user can actually use your site. Using Time to Interactive alone isn’t a wise strategy either. It’s up to you to understand metrics are most important to your site. It’s up to you to continously monitor your site and make sure it’s performing for your users.
Outline
- Web performance is continous
- WebpageTest is the best free tool to measure performance
- Fast on slow means fast on fast
- Test with high latency
- The summary is just the start
- Load Time isn’t the metric you’re looking for
- The Filmstrip View is where the important metrics live
- The network waterfall provides hints of performance improvements
- First Paint, First Contentful Paint, First Meaningful Paint, and Time to Interactive
- Use the network waterfall to find Time to Interactive
- Use Time to Interactive as a guide
- Page load performance is not one metric